

101.1. Navigate the Alerts Viewer interface#
For the Portal Aspect of the Rubin Science Platform (RSP) at data.lsst.cloud.
Data Release: Prompt Products
Last verified to run: 2026-06-17
Learning objective: Use the Alert Viewer to access the contents of a single alert packet retrieved by alert ID.
LSST data products: Alert packets.
Credit: Originally developed by the Rubin Community Science team. Please consider acknowledging them if this tutorial is used for the preparation of journal articles, software releases, or other tutorials.
Get Support: Everyone is encouraged to ask questions or raise issues in the Support Category of the Rubin Community Forum. Rubin staff will respond to all questions posted there.
1. Log into the RSP and enter the Portal Aspect. In a web browser go to data.lsst.cloud, log in and click on the “Portal” panel.
2. Select the Alert Viewer.
Click on the tab labeled “Alert Viewer”. The Alert Viewer requires a known Alert ID, which matches the DiaSourceId of the triggering DiaSource. For the purpose of this tutorial, use the Alert ID 170059317401616524, selected from the ALeRCE broker.
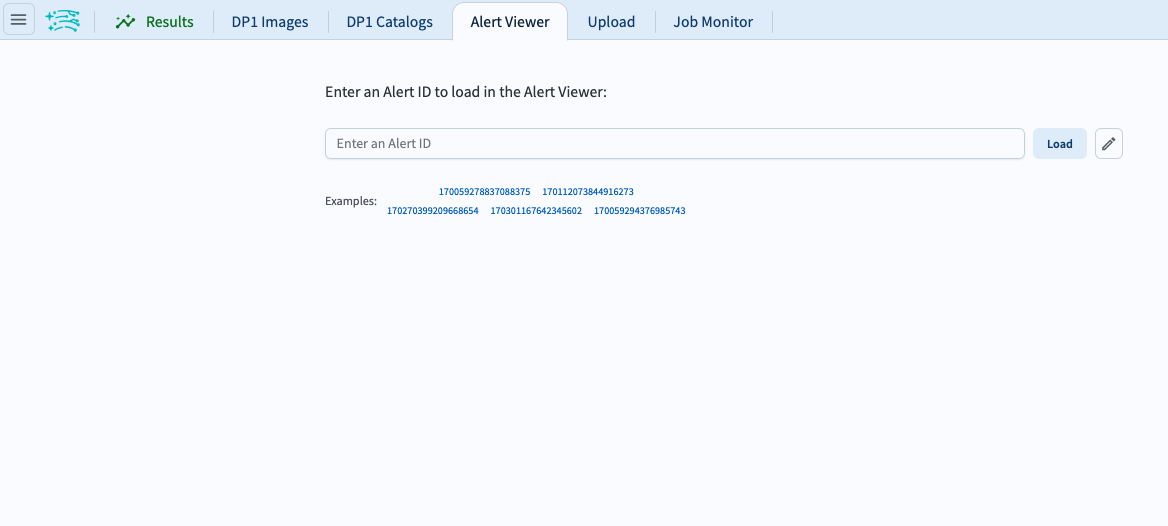
Figure 1: The Alert Viewer search interface.#
3. Retrieve the contents of a single alert packet. Enter alert id 170059317401616524 and hit “load”. The pencil button next to the “load” button shows Alert IDs from recent searches. The Alert Viewer interface will open in a new browser tab.
4. Examine the results for the alert packet.
The results include the full alert packet which contains a table with records of the triggering DiaSource (top left panel), a table with associated DiaSource records (top right panel), a chart for the light curve (top right panel; use the chart/table toggle to switch between views), and cutout postage stamps of the science, template, and difference images (bottom panel).
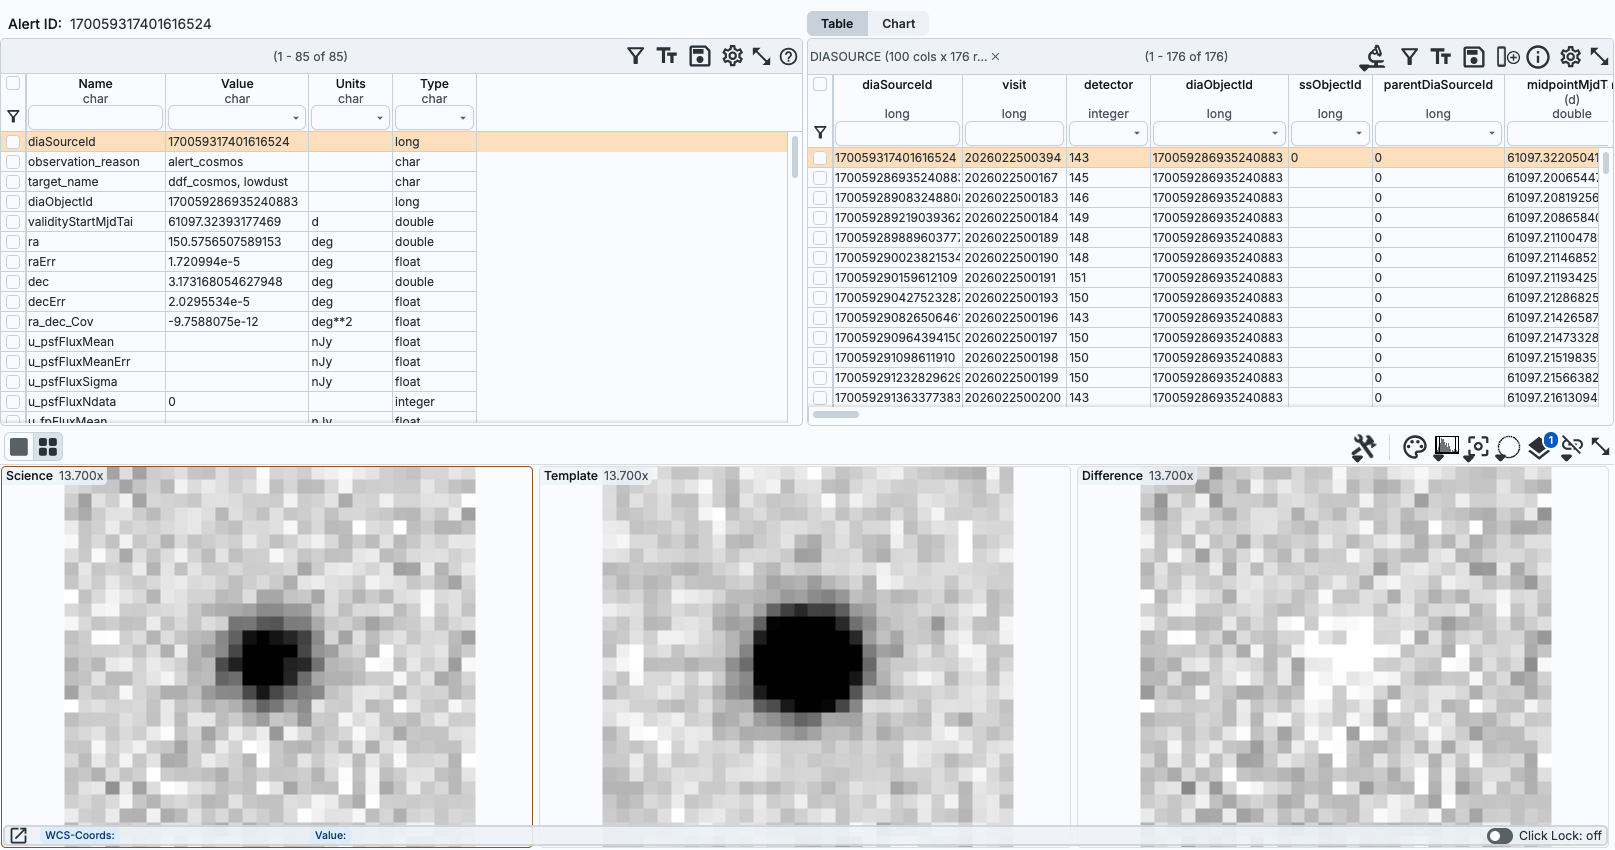
Figure 2: The Alert Viewer results interface showing the contents of the packet for Alert ID 170059317401616524.#
4.1. Examine the triggering DiaSource record:
The results table includes triggering DiaSource record, scheduler metadata, and associated DiaObject or SSObject. If the alert is associated with a SSObject, then this table includes records from mpc_orbits as shown in Figure 3.
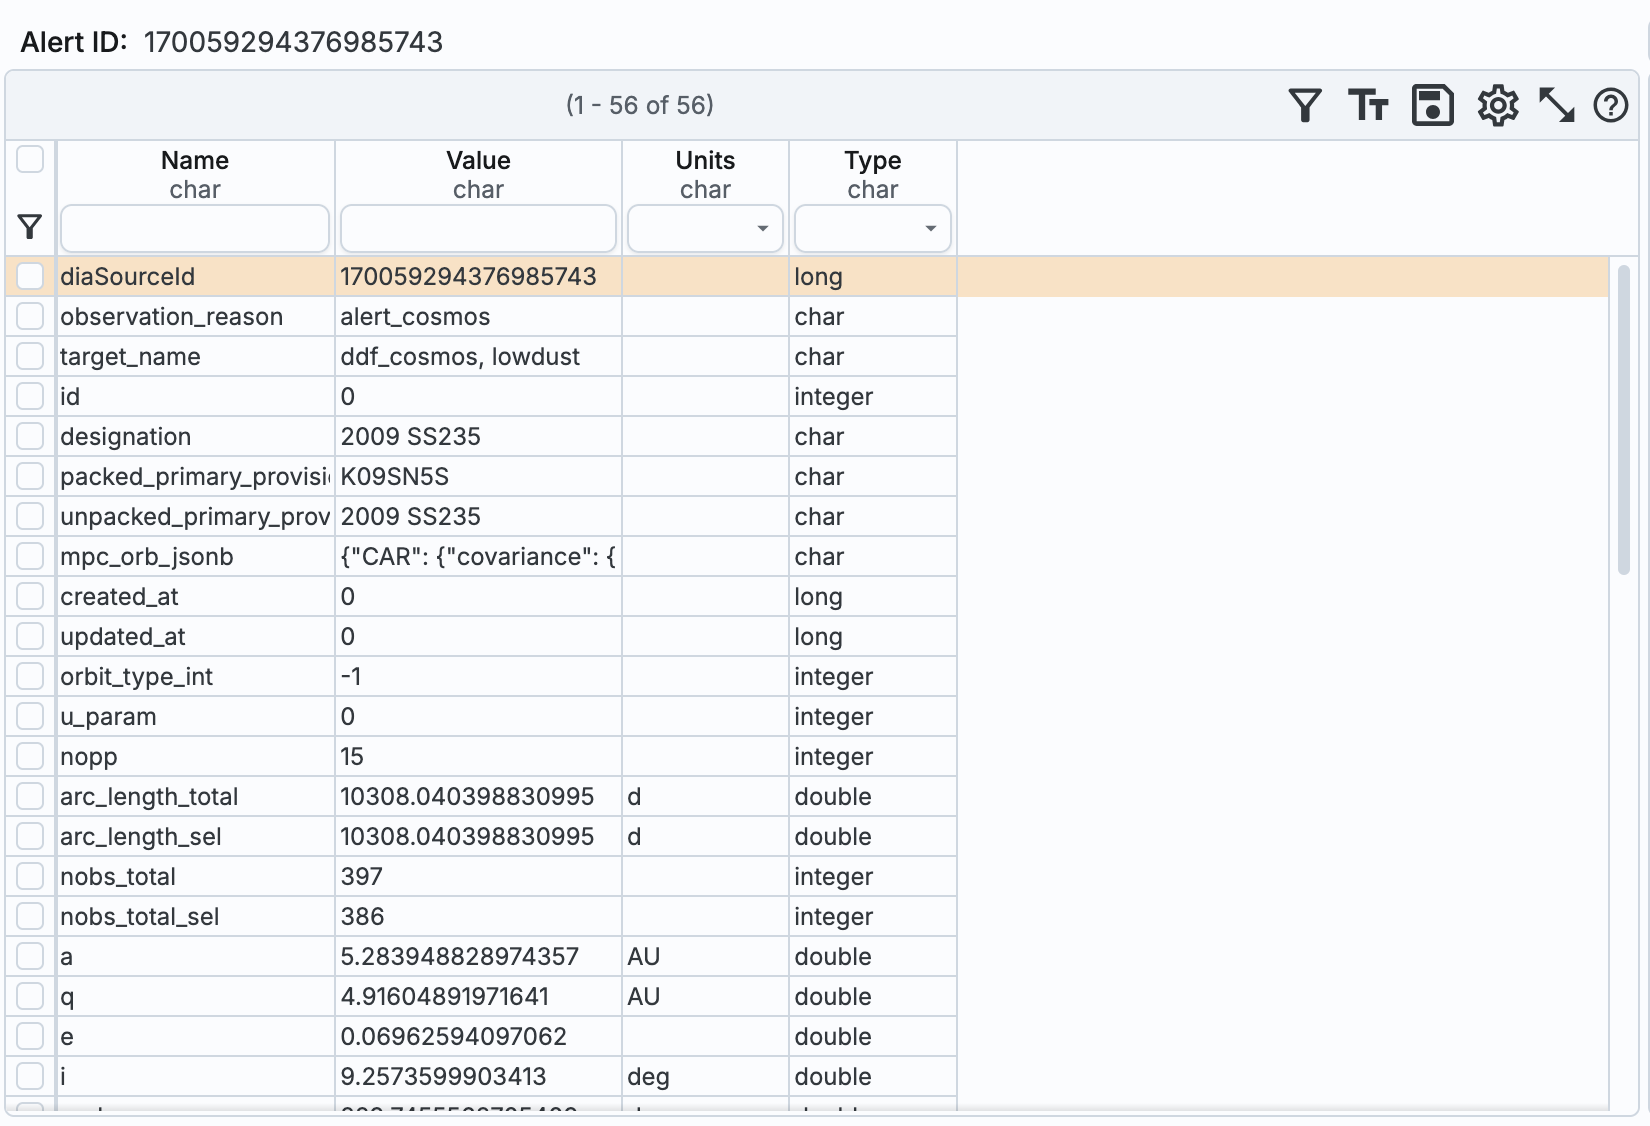
Figure 3: The results table for Alert ID 170059294376985743, associated with a Solar System object.#
4.2. Examine the associated DiaSource records.
Ensure “table” is selected for the top right panel.
The results table includes records from the DiaSource table for the past 12 months for the DiaObject associated with the alert.
4.3. Examine the associated light curve.
Ensure “Chart” is selected for the top right panel.
This changes the view to the light curve for the DiaObject associated with the alert. The default chart shows the light curve with difference-image psfFlux vs midpointMjdTai for all bands.
4.4. Examine the cutout stamps. The cutout stamps include a science image cutout, a template image cutout, and a difference image cutout. The default greyscale colormap used for all three image stamps shows positive flux as white, and negative as black. The colormap and scale can be changed using the palette and histogram buttons in the upper right corner of the bottom panel.
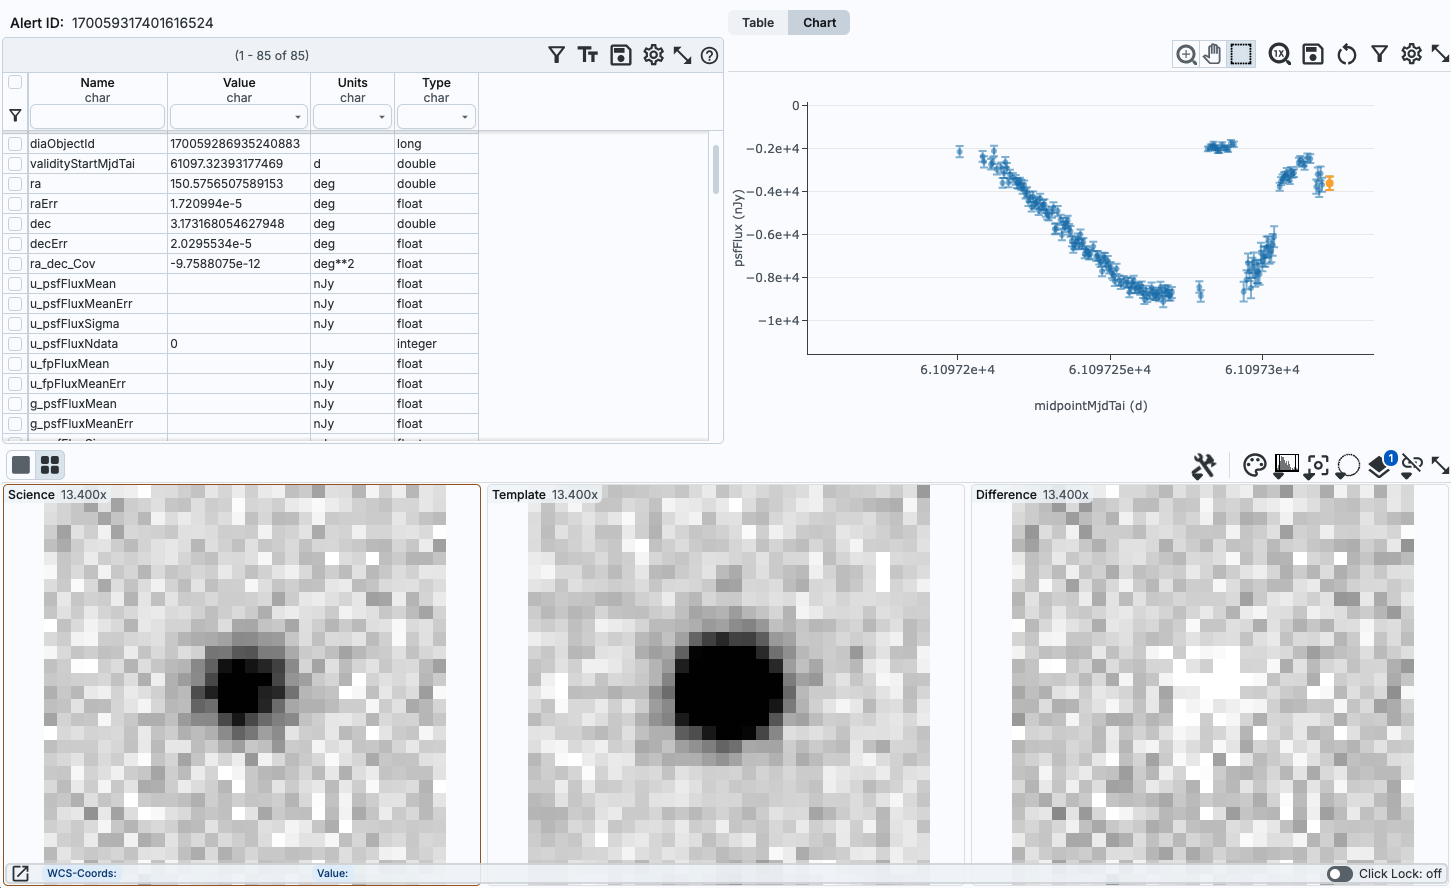
Figure 4: The results interface showing the chart with the light curve for Alert ID 170059317401616524.#